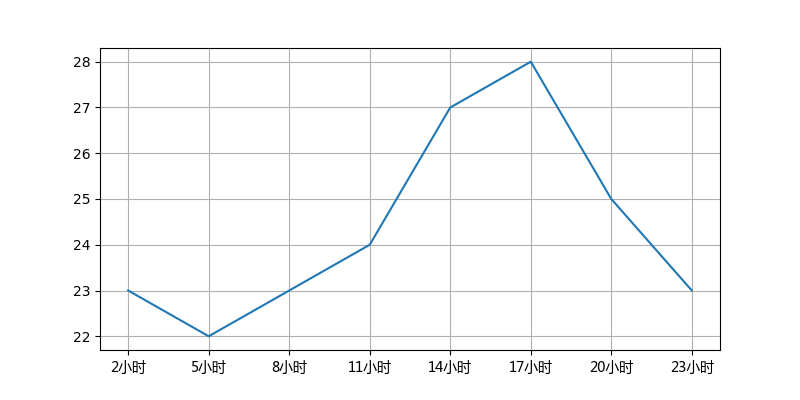
绘制网格
图像显示网格
官方网址:
https://matplotlib.org/api/_as_gen/matplotlib.pyplot.grid.html?highlight=grid#matplotlib.pyplot.grid
语法
matplotlib.pyplot.grid(axis='both',**kwargs)
参数说明
- axis:默认
both,表示x轴、y轴都有网格线,
值为'x'表示x轴显示网格线
值为'y'表示y轴显示网格线 - **kwargs:关键字参数,
alpha:网格透明度,float类型
例子:
import matplotlib.pyplot as plt
import matplotlib.font_manager as fm

# 设置字体
my_font=fm.FontProperties(fname=r'C:\Windows\Fonts\msyh.ttc')

temps=[23,22,23,24,27,28,25,23]
hours=list(range(2,26,3))

# 设置图片大小
plt.figure(figsize=(8,4),dpi=100)

# 设置x轴lable
lables=['%d小时'%item for item in hours]

plt.xticks(hours,lables,fontproperties=my_font)
plt.grid(axis='both',alpha=0.3)

plt.plot(hours,temps)
plt.show()
网格是根据x轴、y轴的刻度绘制的,
如下图: